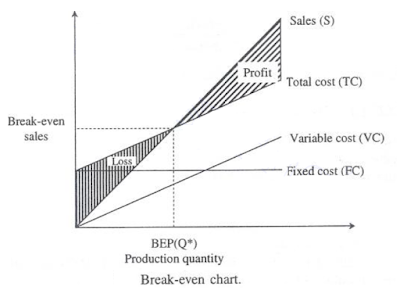
Break Even Analysis / Break Even Chart
BREAK-EVEN ANALYSIS
Concept
Break – even analysis is also known as cost volume profit analysis. It is a tool of financial analysis.
Break – even analysis related with finding the point at which revenues and costs equal exactly. It can be carried out algebraically or graphically.
Break – even point
Break – even point is a point where the total sales are equal to total cost.
Break – even chart
To find the cut-off production volume from where a firm will make profit is the main objective of the break even analysis.
Let
s = selling price per unit
v = variable cost per unit
FC = fixed cost per period
Q = volume of production
The total sales revenue (S) of the firm is
S = s x Q
The total cost (TC) of the firm for a given production volume is given as
TC = Total variable cost + Fixed cost
TC = (v x Q) + FC
The linear plots of the above two equations are shown in Figure.
The intersection point of the total sales revenue line and the total cost line is called the break-even point.
The corresponding volume of production on the X-axis is known as the break-even sales quantity. At the intersection point, the total cost is equal to the total revenue. This point is also called the no-loss or no-gain situation.
For any production quantity which is less than the break-even quantity, the total cost is more than the total revenue. Hence, the firm will be making loss.
For any production quantity which is more than the break-even quantity, the total revenue will be more than the total cost. Hence, the firm will be making profit.
Profit = Sales – (Fixed Cost + Total Variable Costs)
= (s*Q) – (FC + [v*Q])
The formula to find the break-even quantity
The formula to find the break-even sales


